CSD Prime Computer Model 1-130 Rankings After Week Two

I figured I’ll start off by answering some common questions this week.
Q: How is Miami still ranked?
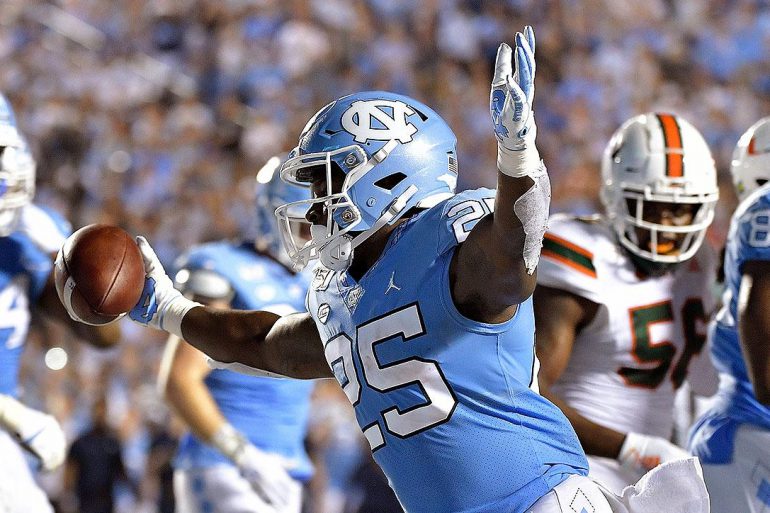
A: They lost to a top ten team by four on a neutral and a top 30 team by three on the road, that kinda holds true with a what a team ranked around 20th should do, slightly overperforming against Florida and slightly underperforming against UNC, thus they haven’t dropped that much.
Q: How is Missouri still ranked?
A: They lost a game against Wyoming in week one with a lot of turnover weirdness and such. The way the model works is a team is assigned a “game score” and based upon whether or not that is better than expected given their opponent they move up or down. The model gave Missouri a 75% chance to beat Missouri week one, and given the stats of the Wyoming game they actually received a game score of 55, basically meaning that ignoring who won, based on the stats of the game Missouri should have won 55% of the time, this is done to avoid weirdness like fluky fumbles in the redzone or random missed kicks that aren’t truly reflective of a team’s actual strength. Essentially, they underperformed against Wyoming but not to the degree the final score would suggest, then they went out and smacked West Virginia this week, so they gained back a lot of the bit they did lose.
Q: That game score thing is interesting, were there any games this week where the team that played better according to the model actually lost?
A: Of course, although it happens less frequently than you’d think. This week there were just two cases, both involving college overtime weirdness: Kent State, which beat Kennesaw State in overtime had a game score of 49, Florida State, which beat ULM in overtime had a game score of 39.
Q: Who was the most dominant team this week?
A: Kansas State, Wisconsin, Ohio State, Indiana, Georgia, Oregon, Alabama, Washington State, Oklahoma, Florida, and NC State all had game scores of 100 this week. The highest game score vs a power-five opponent was Iowa against (of course) Rutgers with a 98.
Q: What is the best conference in college football?
A: Average ratings listed below, no real surprises, the most notable thing probably being that the Sun Belt, generally considered to be the weakest conference, comes in 8th.
- SEC (Average: +9.8)
2. Big Ten (Average: +4.9)
3. Big 12 (Average: +3.7)
4. Pac-12 (Average: +2.9)
5. ACC (Average: +2.5)
6. AAC (Average: -2.7)
7. MWC (Average: -4.1)
8. Sun Belt (Average: -6.7)
9. MAC (Average: -7.2)
10. CUSA (Average: -7.4)
Q: Who are the biggest movers so far?
A: In the positive direction: North Carolina, Utah State, Maryland, SMU, Kansas State, Colorado State, Cal, Tulane, San Deigo State, and Virginia. In the negative direction: Tennessee, Florida State, FIU, Appalachian State, Arizona State, Nebraska, Syracuse, North Texas, Virginia Tech, and UAB.
Q: Best G5s/Worst P5s?
A: Ah, a classic. The current best G5s are:
- UCF
- Boise State
- Memphis
- Cincinnati
- Fresno State
- Utah State
- San Diego State
- BYU (if you count them)
- Toledo
- Temple
The current worst P5s are (with worst being #1):
- Kansas
- Rutgers
- Oregon State
- Illinois
- Louisville
- Tennessee
- Duke
- Georgia Tech
- Arkansas
- Indiana
Q: Alright, can I just see the rankings?
A: Here ya go:
| Rank | Team | Conf | Rating | RANK | Change | YTD Change |
| 1 | Alabama | SEC | 33.08599 | 1 | 0 | 0 |
| 2 | Georgia | SEC | 26.92519 | 2 | 0 | 0 |
| 3 | Clemson | ACC | 22.21501 | 3 | 0 | 0 |
| 4 | Louisiana State | SEC | 19.11623 | 4 | 0 | 0 |
| 5 | Ohio State | Big Ten | 17.93373 | 5 | 0 | 0 |
| 6 | Oklahoma | Big 12 | 16.37617 | 6 | 0 | 0 |
| 7 | Texas A&M | SEC | 13.69634 | 7 | 4 | 4 |
| 8 | Notre Dame | Ind | 12.68836 | 8 | 1 | 2 |
| 9 | Florida | SEC | 11.89075 | 9 | 1 | -1 |
| 10 | Michigan | Big Ten | 11.60558 | 10 | -3 | -3 |
| 11 | Penn State | Big Ten | 10.52036 | 11 | -3 | -2 |
| 12 | Auburn | SEC | 10.33326 | 12 | 0 | 0 |
| 13 | Oregon | Pac-12 | 10.12147 | 13 | 4 | 4 |
| 14 | Texas | Big 12 | 9.790799 | 14 | 1 | 0 |
| 15 | Mississippi State | SEC | 9.693867 | 15 | -2 | -2 |
| 16 | Wisconsin | Big Ten | 8.754645 | 16 | 2 | 11 |
| 17 | Miami (FL) | ACC | 8.602314 | 17 | -1 | 1 |
| 18 | Iowa | Big Ten | 8.515574 | 18 | 1 | 1 |
| 19 | Central Florida | AAC | 8.330505 | 19 | 2 | 3 |
| 20 | Missouri | SEC | 6.905871 | 20 | 2 | -4 |
| 21 | Utah | Pac-12 | 6.750926 | 21 | -1 | 7 |
| 22 | Southern California | Pac-12 | 6.650839 | 22 | 5 | 1 |
| 23 | Oklahoma State | Big 12 | 6.187131 | 23 | 0 | 3 |
| 24 | Washington | Pac-12 | 6.017842 | 24 | -10 | -9 |
| 25 | Michigan State | Big Ten | 5.756093 | 25 | -1 | -5 |
| 26 | Boise State | MWC | 5.568146 | 26 | -1 | 6 |
| 27 | Texas Christian | Big 12 | 5.062925 | 27 | 1 | -2 |
| 28 | Minnesota | Big Ten | 5.0003 | 28 | 15 | 10 |
| 29 | North Carolina | ACC | 4.507913 | 29 | 10 | 33 |
| 30 | Stanford | Pac-12 | 4.373999 | 30 | -4 | -6 |
| 31 | Virginia | ACC | 4.314181 | 31 | -1 | 14 |
| 32 | South Carolina | SEC | 4.076443 | 32 | -1 | -11 |
| 33 | Northwestern | Big Ten | 3.93109 | 33 | 1 | 7 |
| 34 | Maryland | Big Ten | 3.777269 | 34 | 21 | 25 |
| 35 | Kansas State | Big 12 | 3.385608 | 35 | 11 | 19 |
| 36 | North Carolina State | ACC | 3.299047 | 36 | 2 | -1 |
| 37 | Memphis | AAC | 3.162661 | 37 | -8 | -7 |
| 38 | Washington State | Pac-12 | 3.143485 | 38 | 7 | 3 |
| 39 | Iowa State | Big 12 | 2.776653 | 39 | -3 | -8 |
| 40 | California | Pac-12 | 2.547569 | 40 | 25 | 16 |
| 41 | Cincinnati | AAC | 2.400967 | 41 | 1 | 3 |
| 42 | Kentucky | SEC | 2.180927 | 42 | -10 | -6 |
| 43 | Baylor | Big 12 | 2.051593 | 43 | 10 | 7 |
| 44 | Purdue | Big Ten | 2.022051 | 44 | 4 | -1 |
| 45 | Nebraska | Big Ten | 1.955811 | 45 | 5 | -16 |
| 46 | Fresno State | MWC | 1.782309 | 46 | -13 | 5 |
| 47 | Utah State | MWC | 1.695648 | 47 | 4 | 26 |
| 48 | Mississippi | SEC | 1.691177 | 48 | -7 | 0 |
| 49 | Virginia Tech | ACC | 1.59731 | 49 | -14 | -12 |
| 50 | West Virginia | Big 12 | 1.142465 | 50 | 2 | -8 |
| 51 | San Diego State | MWC | 0.567442 | 51 | 25 | 15 |
| 52 | Vanderbilt | SEC | 0.524253 | 52 | 6 | 5 |
| 53 | Arizona State | Pac-12 | 0.436715 | 53 | -16 | -20 |
| 54 | Colorado | Pac-12 | 0.387931 | 54 | 35 | 9 |
| 55 | Arizona | Pac-12 | 0.287892 | 55 | -8 | -8 |
| 56 | Boston College | ACC | 0.22933 | 56 | 1 | 8 |
| 57 | Brigham Young | Ind | 0.163802 | 57 | 11 | 1 |
| 58 | Pittsburgh | ACC | -0.21455 | 58 | 1 | -5 |
| 59 | UCLA | Pac-12 | -0.32177 | 59 | -15 | -10 |
| 60 | Syracuse | ACC | -0.33369 | 60 | -11 | -14 |
| 61 | Toledo | MAC | -0.35404 | 61 | 5 | 13 |
| 62 | Temple | AAC | -0.64396 | 62 | 1 | 8 |
| 63 | Wake Forest | ACC | -0.68431 | 63 | 4 | -8 |
| 64 | Houston | AAC | -0.95411 | 64 | -8 | 1 |
| 65 | Southern Methodist | AAC | -1.0305 | 65 | 6 | 24 |
| 66 | Florida State | ACC | -1.05096 | 66 | -26 | -32 |
| 67 | Indiana | Big Ten | -1.18064 | 67 | 2 | -6 |
| 68 | Army | Ind | -1.18277 | 68 | 19 | 10 |
| 69 | Tulane | AAC | -1.2675 | 69 | 11 | 15 |
| 70 | Arkansas | SEC | -1.29109 | 70 | 7 | -2 |
| 71 | Texas Tech | Big 12 | -1.29714 | 71 | -9 | -11 |
| 72 | Ohio | MAC | -1.42715 | 72 | 1 | 0 |
| 73 | Marshall | CUSA | -1.55603 | 73 | 8 | -6 |
| 74 | Appalachian State | Sun Belt | -1.67621 | 74 | -20 | -22 |
| 75 | South Florida | AAC | -1.81181 | 75 | 17 | 0 |
| 76 | Georgia Tech | ACC | -1.82225 | 76 | -16 | -7 |
| 77 | Duke | ACC | -1.93185 | 77 | 1 | -6 |
| 78 | Florida Atlantic | CUSA | -1.94404 | 78 | -14 | 1 |
| 79 | Arkansas State | Sun Belt | -1.95469 | 79 | 3 | -3 |
| 80 | Northern Illinois | MAC | -1.98618 | 80 | 11 | 5 |
| 81 | Tennessee | SEC | -2.07676 | 81 | -20 | -42 |
| 82 | Southern Mississippi | CUSA | -2.13925 | 82 | 6 | 0 |
| 83 | Troy | Sun Belt | -2.57102 | 83 | 0 | -6 |
| 84 | Western Michigan | MAC | -2.68991 | 84 | 11 | 2 |
| 85 | Wyoming | MWC | -3.12751 | 85 | -15 | 5 |
| 86 | Tulsa | AAC | -3.42299 | 86 | 8 | 12 |
| 87 | Colorado State | MWC | -3.5159 | 87 | -12 | 16 |
| 88 | Louisville | ACC | -3.55454 | 88 | 2 | 4 |
| 89 | Illinois | Big Ten | -3.56062 | 89 | -17 | -8 |
| 90 | Louisiana | Sun Belt | -3.76743 | 90 | -4 | -2 |
| 91 | Georgia Southern | Sun Belt | -3.87602 | 91 | 2 | 2 |
| 92 | Middle Tennessee State | CUSA | -3.90728 | 92 | -18 | 2 |
| 93 | North Texas | CUSA | -4.08871 | 93 | 5 | -13 |
| 94 | Nevada | MWC | -4.19463 | 94 | -9 | 1 |
| 95 | Air Force | MWC | -4.36079 | 95 | 1 | 2 |
| 96 | Buffalo | MAC | -4.40386 | 96 | 9 | 4 |
| 97 | Louisiana Tech | CUSA | -4.87625 | 97 | -18 | -10 |
| 98 | Oregon State | Pac-12 | -5.04987 | 98 | 4 | 3 |
| 99 | Western Kentucky | CUSA | -5.36604 | 99 | 8 | 6 |
| 100 | Hawaii | MWC | -5.53258 | 100 | -1 | 2 |
| 101 | Eastern Michigan | MAC | -6.1068 | 101 | 5 | 5 |
| 102 | Miami (OH) | MAC | -6.46148 | 102 | -2 | -3 |
| 103 | Alabama-Birmingham | CUSA | -6.59812 | 103 | -2 | -12 |
| 104 | Rutgers | Big Ten | -6.76636 | 104 | -1 | 0 |
| 105 | Florida International | CUSA | -7.02564 | 105 | -21 | -22 |
| 106 | East Carolina | AAC | -7.33331 | 106 | -2 | 1 |
| 107 | Kansas | Big 12 | -8.13407 | 107 | -10 | -11 |
| 108 | Kent State | MAC | -8.24439 | 108 | 2 | 3 |
| 109 | Texas State | Sun Belt | -8.35692 | 109 | 2 | 3 |
| 110 | Louisiana-Monroe | Sun Belt | -8.58337 | 110 | 7 | -1 |
| 111 | Charlotte | CUSA | -9.89385 | 111 | 7 | 3 |
| 112 | Georgia State | Sun Belt | -10.2492 | 112 | -3 | 8 |
| 113 | Nevada-Las Vegas | MWC | -10.9181 | 113 | -1 | -5 |
| 114 | Old Dominion | CUSA | -11.0021 | 114 | 5 | 1 |
| 115 | Navy | AAC | -11.0756 | 115 | -1 | -5 |
| 116 | Ball State | MAC | -11.3618 | 116 | -8 | -3 |
| 117 | Texas-San Antonio | CUSA | -11.8482 | 117 | -2 | 2 |
| 118 | Liberty | Ind | -12.2958 | 118 | 2 | 3 |
| 119 | South Alabama | Sun Belt | -12.4246 | 119 | -6 | 4 |
| 120 | Bowling Green State | MAC | -12.8517 | 120 | -4 | -2 |
| 121 | New Mexico | MWC | -13.4498 | 121 | 0 | -4 |
| 122 | Coastal Carolina | Sun Belt | -13.7004 | 122 | 6 | 6 |
| 123 | San Jose State | MWC | -14.0084 | 123 | -1 | -7 |
| 124 | Rice | CUSA | -14.5104 | 124 | -1 | 3 |
| 125 | Central Michigan | MAC | -14.8254 | 125 | -1 | -3 |
| 126 | Akron | MAC | -15.0957 | 126 | 1 | 0 |
| 127 | New Mexico State | Ind | -15.3068 | 127 | -2 | -2 |
| 128 | Massachusetts | Ind | -17.5731 | 128 | -2 | -4 |
| 129 | Connecticut | AAC | -18.9342 | 129 | 1 | 0 |
| 130 | Texas-El Paso | CUSA | -19.4175 | 130 | -1 | 0 |


